![Page Speed For SEO [Resource]](https://timresnik.com/wp-content/uploads/2018/10/speed_google-1067x675.jpg)
What is Page Speed
Google is obsessed with the user experience, and research suggests that people care a lot about how fast pages load. On July 9, Google announced “The Speed Update“, and now uses speed as a variable it it mobile ranking factors. Considering more than 50% of Google searches are initiated on a mobile device, this was big news. In its most basic form, page speed is the the amount of time it takes to load a page, as perceived by the user. Some pages may initially load quickly, but do not give the user the elements she wants until later. Other pages may take a while to load, but provide the user with enough above the fold content that they perceive the page to be loaded. and of late, hyper focused on the a users mobile experience. In a study that Google originally published in February 2017, they found that the average load time for a site on mobile is “about 15 seconds”, and for over 70% of the pages they analyzed it took more than 5 seconds for above the fold content to appear. In terms of user engagement and conversions, lack of speed kills . Google found that “as page load time goes from one second to 10 seconds, the probability of a mobile site visitor bouncing increases 123%.”

As you begin the analysis of your own site speed keep in mind almost every site out there sucks at mobile page speed in some way or another. I say this not to make you feel better, and convince you into complacency. Rather, I point it out to remind you that you can get an upper hand on your competition who IS complacent.
Tools for Testing Page Speed
There a plenty of free and paid page speed tools that can be used to help with optimization efforts. However, these two free tools will provide everything you need to get a good picture of issues that your pages face.
How to Test your Page with Google PageSpeed Insights
Google PageSpeed Insights is the defacto speed test in the SEO’s tool belt. It provides you a 30,000 foot view of performance and gives a handful of technical recommendation.

PageSpeed Insights has limitations for smaller sites and pages that don’t receive a lot of traffic (I’m looking at you category pages) because it uses data from the Chrome User Experience Report that aggregates key user experience metrics from users who have opted-in to share data with Google in the Chrome browser. Smaller sites typically do not gain enough traffic from these users, and therefore will not have aggregate user experience metrics.
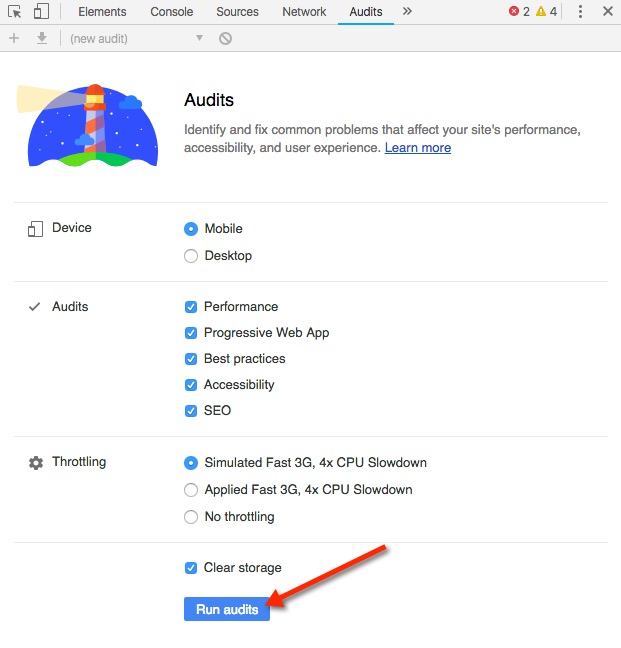
How to Run Lighthouse Audit (chrome browser)
While Page Speed Insights uses aggregate data from Chrome users, Lighthouse emulates slow mobile speeds and audits pages straight from your browser. The level of detail that the audit produces is much greater, but can also be overwhelming. Here’s the process:

1
Open your chrome browser
(make sure you have the latest version) and navigate to the page you want to test. Note: I usually test by page template (home, blog, category, product pages, etc)
2
Navigate to “Developer Tools”:

3
Navigate to “Audits”

4
Run the audit
5
Review the results
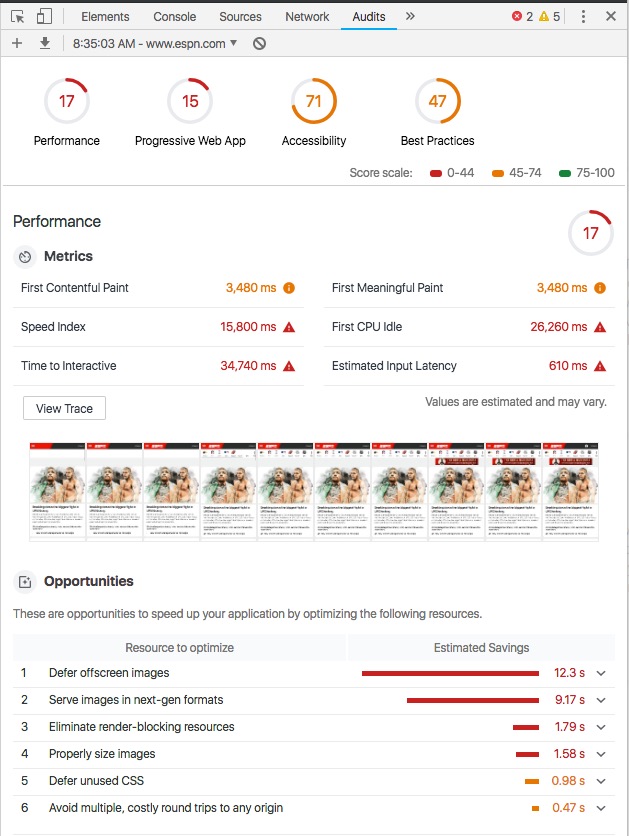
Don’t get too overwhelmed at this point. And, remember what I said earlier, everyone is bad at this. Here is a billion dollar site, ESPN, that scores a 17/100 on performance. Tools to dive deeper: Chrome dev tools, WebPage Test, Yslow, Pingdom, TestMySite.
What are the important page speed metrics

The metrics displayed in your audit results are called “user-centric metrics.” As I talked briefly about above, the measurement of page speed is measured by the perception of the user, and since load times for pages vary drastically depending on myriad factors, the industry prefers to use metrics that are based on the user experience. At this point, we want to understand what these metrics mean and what goes in to them:
- First Contentful Paint: this is the event that immediately follows the first navigation to the page and when the first pixels begin to render. The subjective measurement to this event in the user’s view is the realization that something is happening
- First Meaningful Paint: this is the measurement of when the first “useful” piece of content appears on the page, such as a play button for video, body text for an article, a product description or picture for an ecommerce site. Again, this is subjective in the eyes of the user, but is typically obvious.
- Speed Index: this measures the completeness of the visual elements of the page on a timeline. The audit tool captures screen shots of load in increments and compares the visual elements loaded in each. This is an important metric to measure the progress of your optimization effort, and for competitive comparison.
- First CPU Idle: this metric used to be called “First Interactive”. It measures the time it takes for most of the interactive elements on the screen to be displayed. From a user perspective, this means she can click, play, read, or move on from the page easily
- Time to Interactive: this measures the time it takes the page to load to the point where the page is ready for user input, and can respond to user interaction in a fraction of a second (50 milliseconds
- Estimated Input Latency: this measures the estimated latency between when the user takes an action and the time it takes for the app to respond. Lighthouse recommends that this time is under 50 milliseconds. In the example above ESPN’s score is 12x this high.
Page Speed Optimization Plan
To create your page speed optimization plan run all your important templates through PageSpeed Insights and Lighthouse and record the metrics for all. Next look at the aggregate recommendations in each tool and prioritize by “estimated savings” in the LightHouse audit and the amount of time/effort each task will take. The critical actions that can be taken to improve page speed:
Leverage browser caching: Browser caching is a directive in the header of the HTML document that tells the browser or server to store the content for a certain amount of time (10 minutes, a day, a month, a year) so the browser/server/crawler does not need to spend the resources to load all the resources of the page on each visit. Google recommends that for static content that cache be set for at least one-week and up to one-year. Content that changes frequently, such as breaking news, should not use a cache control.

Leverage Browser Caching
Browser caching is a directive in the header of the HTML document that tells the browser or server to store the content for a certain amount of time (10 minutes, a day, a month, a year) so the browser/server/crawler does not need to spend the resources to load all the resources of the page on each visit. Google recommends that for static content that cache be set for at least one-week and up to one-year. Content that changes frequently, such as breaking news, should not use a cache control.


Defer render blocking JavaScript or CSS
Prior to rendering a page completely, a browser must load the necessary JavaScript and CSS on the page. Loading unnecessary CSS or making calls to load external JavaScript files can slow the load times of the “paint” and interactive metrics mentioned above. It is recommended that unnecessary JavaScript, especially external scripts, be removed or loaded asynchronously after the first render of the page. Multiple calls to different large CSS files should be avoided, critical CSS should be inlined, and non-critical CSS should be deferred.

Enable GZIP compression
Once you have removed or deferred resources that are not critical to the initial user experience, a page size and load time can be substantially reduced by enabling compression on the remaining resources, such as text, images and fonts. GZIP is a compressor that focuses on visible and non-visible text (JavaScript, CSS, etc) within an HTML document. The performance improvements that compression provides can be seen in the “network” tab in the developer panel in Chrome. In this example Amazon.com the top number is response size and the bottom number is actual content size, and has compresses from nearly 500K to 100K, representing an 80% compression rate.


Improve server response time
The performance of the server in which a page is served is a factor when evaluating page speed. Server response time is the the amount of time it takes for a request from a browser to be fulfilled, and is often expressed as “Time to First Byte” (TTFB). Google says that server response time should be under 200 milliseconds, or 2/10ths of 1 second.
To check your server response time, there are several tools. One such tool, WebPageTest, represents this number as Time to First Byte. In the example below, ESPN clocks in a 300 milliseconds. This is right above the 200 ms threshold and does not require urgent attention. Sever responses that are edging toward 1 second and above, should be aggressively prioritize. Potential causes of slow response times include high demand on the servers, poor configuration or network problems. Dynamic content, or content that makes many server calls per session can also cause servers to slow down. In this case, leveraging browser caching will help with TTFB.

Avoid landing page and other redirects
Some pages use HTTP or JavaScript redirect to direct mobile users to a mobile specific version of the site. These pages incur extra server roundtrips and DNS lookups, all of which take time, and slow down the experience for the user. Sites, that use responsive web design, and serve the same page no matter the device, do not need to worry about this. Resources within a page that 3XX redirect to a new location should be updated to point to the 200 OK version. So for example, if example.com/cssmain redirects to example.com/cssmain1, update the page to instead just point at example.com/cssmain1. Redirects on critical resources that are required to render the page, should especially be avoided.
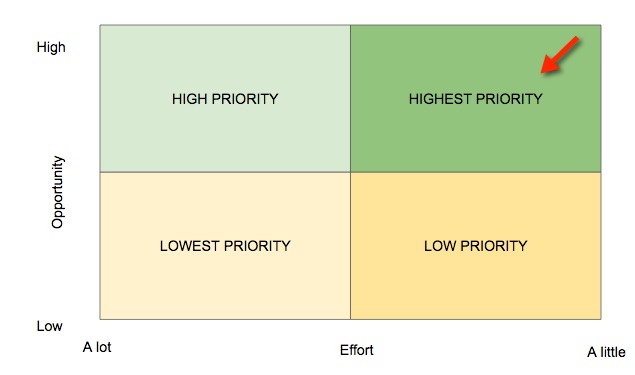
Prioritize your work
Now that you have done a thorough speed audit of your site and templates, it’s time to tackle the work. A lot of organizations have a tough time figuring out what to do first. I frequently recommend to clients that they plot the projects in the following matrix, stack rank, and tackle.